Blue Whale Processing 0.7 released

We are pleased to announce release of the 0.7 version of the Blue Whale Processing Geophysical Software. The 0.7 version is available for download in the Downloads section.

Your installation of 0.6 version will be upgraded automatically. Development version 0.7 will not be switched to the release version automatically, please uninstall the development version and install the stable release version instead.

0.7 version highlights:

  • Extended data editing features, copy/paste groups of cells from/to a spreadsheet program, undo/redo.
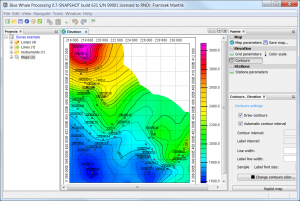
  • Mapping module with live data contours maps.
  • Regional terrain corrections module supporting Hammer method and Plouff method computation based on SRTM3 digital terrain model.
  • Enhanced referencing and coordinate systems transformations, support for EGM-96 elevation datum. Support for UTM coordinates input.
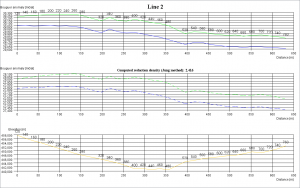
  • Experimental line profile plot with implementation of modified Nettletton method for reduction density estimation.
  • Rewritten data import tools.
  • Tool for multiple readings selection inside a gravity loop.
  • Shift readings time tool applicable for a loop or entire project. Allows fixing incorrectly set time or time zone in the gravimeter. In addition, tool for estimation of the proper time shift from the repetitions statistics is included.
  • Experimental support for Mac OSX.

Detailed description of new features can be found in the User’s Guide.
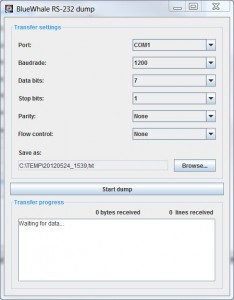
BlueWhale RS-232 dump utility

Easy-to-use utility for dumping data from instruments equipped with RS-232 output is available for download. At this moment, the utility is provided for free.

System requirements:

Windows XP/Vista/7 32 or 64 bit or Linux 2.6
1 COM port (RS-232) or RS-232 USB adapter with functional drivers for the given system installed
Sun Java JRE 1.6 or newer (available at http://java.com/download)

Installation instructions:

Unpack all files to a dedicated folder at the destination computer.

Operation on a Windows computer:

1. Connect instrument to the appropriate COM port.
2. Run rs232dump.bat.
3. Select proper port and adjust communication parameters.
4. Click “Browse” button to select destination file.
5. Click “Start dump” button.
6. Start dump in the connected instrument.
7. Program shows transfer progress. Wait until all data are transferred.
8. Click “Stop” button to stop transfer and close destination file.
9. Repeat steps 4-8 when needed.
10. Close program window.

Important note:

Software clears the destination file when “Start dump” is pressed.

Linux users can run the following command at the installation folder:

java -jar Rs232Dump.jar

Line profile plots and reduction density assessment

Starting from Development version 0.7 build 529, Bouguer anomalies and elevations can be plotted over project lines.

Line profile plot can be activated from line edit window.

In addition, reduction density can be assessed based on current reduction density, stations elevations and complete Bouguer anomalies. Jung method, i.e. modified analytic version of the Nettletton method is used for the assessment. Computed reduction density is printed in the plot together with profile plot of Bouguer anomalies computed from the newly assessed reduction density value so as the interpreter can immediately campare influence of the density change.

Context menu is used to toggle density assessment on/off and to save plot as .png picture.

Project file association in Windows

Starting from Build 524 of the Development version 0.7, software installer creates project files (*.fsp) association with the application when the software is installed in Windows. Application can be run from the project’s context menu or double-clicking the project file in Windows Explorer. When the BlueWhaleProcessing application is started, project under question is opened automatically.

Please note that the association is created by application installer. If you want to use it, uninstall the application and install it with the installer build 524 or later. No data will be lost by re-installation of the software.

New data editing features

Starting from Development version 0.7 Build 423, spreadsheet cell-based editing features are available.

New behavior affects any Loop table and Line table for editing gravity readings and stations data.

Single cell can be selected by mouse click or arrows keys. Group of cells can be selected by simultaneous pressing of the Shift key.

Selected cells can be copied to clipboard using Copy function from Context menu (right-click the selection), Edit-Copy from the main menu, toolbar button or pressing Ctrl-C. Data from clipboard can replace existing table data using Paste function, toolbar button or pressing Ctrl-V when upper-left corner of the target area is selected.

Similar way it is newly possible to copy data from/to a spreadsheet software like MS-Excel using Copy-Paste sequence in the desired direction.

Finally, cell-based Undo/Redo feature has been implemented. Cells changes in the Loop or Line table can be undone in reverse order or redone back until new change takes place. Use Edit-Undo or Edit-Redo menu items, and  toolbar buttons or Ctrl-Y and Ctrl-Z keys.

Enhancements in the Development version

Enhancements and fixes listed below were added to the Development version of the software.

Coordinate systems and referencing

  • New coordinate systems referencing features introduced (Build 256):
    – selection from all available coordinate systems for project area corresponding to coordinates in Project properties
    – internal data are saved in WGS84 / ellipsoidal heights for all projects
    – output and projected systems are consistent (only consistent options are offered)
    – vertical datum EGM96 introduced in addition to existing EGM84
    Please note that due to referencing change, all projects made in pre-256 builds of software are recalculated to WGS84 when opened/saved in 256+ build for the first time. Please recheck your Project Properties coordinaate system settings after software version change.
    Using of EGM96 vertical datum instead of previous EGM84(180) is highly recommended for gravity applications.
    Please note that any import/editing of data is provided in the coordinate system which was set in Project properties dialog. Change of the system in Project properties does not affect any existing data. All data are internally stored in WGS-84 Ellipsoidal vertical datum.
  • Stations coordinates can be imported in UTM coordinates instead of geographic. Please check your UTM zone setting in Project properties before importing data. UTM zone is set automatically according to the Project coordinates.For details review Import stations coordinates chapter of the Development version User’s Guide (Build 251)

Mapping module

  • Replot map every 1000 iterations when gridding with minimum curvature method. You can monitor gridding process on the fly. Number of iterations between replots can be adjusted in the Grid parameters palette dialog. (Build 240)
  • Gridding can be stopped at any time. It is particularly helpful if gridding parameters were not set properly. (Build 240)
  • Map is replotted when zoom factor changed. This feature avoids blurring when map is zoomed. If precise scale is not needed, optimal adjustment of map look can achieved by mouse wheel zooming. The same zoom factor is used for printing/saving of the map as well. (Build 260)
  • Predictive Minimum Curvature gridding option added. When checked, minimum curvature gridding progress is made a little faster using predictions from last 30/60 iterations. When trend for a particular station in last 60 iterations is similar to the trend over last 30 iterations, prediction is made weighted by trends similarity factor. Predictive gridding can converge faster than gridding without predictions especially in areas of extrapolations, nevertheless it can be unstable under some circumstances. (Build 264)
  • Stations without readings are newly not plotted in maps by default. New option for turning their plotting on useful for survey planning was added to Map properties palette dialog. (Build 248)

Data editing, presentation and reporting

  • Printing of maps, plots and reports. Maps, reports and plots can be printed directly from the software without need to save them and print from external software. Select File-Print from the main menu to open a rich Print preview dialog with many options allowing precise fine-tuning of the printing process. (Build 244)
  • New feature Group select readings . Group selection can be applied for all readings of a selected loop. Three options are available: 1. last reading from each station occupation will be selected (option used when importing data from instrument dump), 2. all readings will be unselected, or  3. last reading plus every reading back in a given time interval will be selected.  Second option is particularly useful if you want to delete a loop – all readings must be unselected in order to do it. The last option is helpful for cycle-mode instrument drift stability analysis. (Build 242)
  • Line number and picket height (optionally) appear in the Loop closure part of the Loop report. (Build 247)
  • Optimization of project recalculation. When editing data in the Loop table, only affected loop is recalculated. Please note that when you are finished with editing, full recalculation by pressing the button is recommended. (Build 250)
  • Line renaming feature added. Line name/number can be changed. No readings data are changed. This feature is useful if your line name/number is incorrect for any reason. (Build 265)
  • Loops presentation in the Projects window has been enhanced. Number of selected readings instead of all readings is shown in addition to the loop closure result, i.e. standard deviation of the in-loop repeats. Color of the text as well as tooltip text presents loop state and quality of loop closure assessment. (Build 266)

Program internals

  • System libraries upgrade. Upgrade of system libraries to most up-to-date versions. Please find here detailed instructions how to solve problems with libraries update. (Build 254)

Build numbers in parenthesis represent software build where the particular feature has been introduced. Build number of your program installation can be found in the title of main window, in the About dialog and in the name of the Development version installation package. When your installation is updated using Help-Check for Updates or Tools-Plugins menu option, build number is updated accordingly.


Data import and processing enhancements

New features were added to the latest Development version:

  • Import gravity data from the Scintrex CG-3 instrument dump.
  • Imported coordinates file in CSV format can contain terrain corrections for each station computed by an external software.
  • Format of imported file is recognized automaticaly by the BlueWhaleProcessing software. Current version distinguish between gravity data import and coordinates import only.
  • Detailed terrain data can be imported in CSV format. Terrain data are used exclusively or in conjunction with the SRTM-3 data for computation of terrain corrections using Hammer method.

In addition to the above, several less pronounced enhancements were introduced:

  • Automatic project recalculation with each data change can be suspended in Project properties dialog.
  • Saving of maps grids is controlled from Project propertise dialog. Grid data make project files bigger and increase opening/saving time. On the other hand when grids are not saved, regridding is needed when a map is opened. Not saving grids with project data is a new default.
  • Repeated readings at non-base stations can be excluded from drift calculation. This option is useful when for some reason non-base readings are less reliable than base readings e.g. because of shorter observation span.

Mapping module introduced

Support of stations maps and grid plots including contours was included into the software. Updated modules are available for download in the Development version of the software.

Arbitrary number of maps can be created under a new node Maps in the project structure. Every map can currently contain stations locations plot together with the coloured grid of one of four supported fields, terrain elevations, free air anomalies, Bouguer anomalies or complete Bouguer anomalies. Maps can be plotted in various scales. Export to image file (PNG) is included.

Parameters of maps can be easily adjusted by the use of handy palette toolbox. All parameters are preserved in the project fsp file.

Two methods are currently available for gridding of raw stations data, Inverse Distance Weighting method (IDW) for fast preview and optimized minimum curvature method for precise data analysis and presentation. Parameters of both methods can be adjusted for optimal performance under given survey conditions.

Presented map is a Complete Bouguer Anomaly map from the Survey example, one of the three Sample projects provided with the software.

Mapping module is EXPERIMENTAL at this moment. Please note that significant changes into data structures and many software modules were forced by implementation of the mapping facility. Some of the structures definitions can change in future version which could cause incompatibility of the generated maps with newer versions of the software.

Please feel free to test the new functionality, nevertheless it is not yet recommended to depend on new functions in any critical production environment.

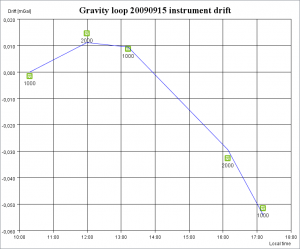
Drift plot is available in the Development version

Graphical representation of the instrument drift model together with all repeated readings is available in the Development version of the software.

Blue line at the plot connects the modelled instrument drift values for each observation time where repeated reading is available. Centers of readings icons – green squares at the presented example – represent observed values of instrument drift. Value of residual, i.e. difference between the model and observed drift, is displayed when mouse pointer is held above a particular reading icon.

Presented example is plot of one of the Tie example loops included with the software distribution.

Plot for each loop is available as a third tab in the Loop editor. Double click the loop icon in the Projects tree and in the Editor window select “View drift plot” button.

You can right-click the plot to save it as a png file. Dimensions of the saved picture are the same as the editor window size. If you want to get a picture suitable for publication, maximaze the window while exporting.

Blue Whale Processing version 0.6 released

Pre-release version 0.6 of the software is available for download.

Upgrade from the previous versions:

  • Uninstall the old version
  • Install the new version

Main changes in the new release:

  • Non-licensed copy of the software operates newly in Viewer mode
  • Welcome page with quick links to introductory steps with the software and automaticaly updating news
  • Quick start guide and three Data import guides included into Help system
  • Three sample projects for quick learning of the software features included; sample project can be opened from the Welcome page
  • SRTM data automatic download – 3 arcSec SRTM data used for terrain corrections computations can be automaticaly downloaded from the Internet when needed
  • Command line parameter – software can be started with a command-line parameter – name of the project file; this project is opened after start-up
  • Generic instrument types with and without calibration table added
  • data imported from a gravity meter dump file are locked from editing
  • instrument-computed tidal corrections can be replaced with the corrections computed by the software; this feature is particularly useful if gravity meter settings were incorrec during data acquisition or instrument can not compute tidal corrections at all
  • many bug fixes and enhancements.

Release history:


Release 0.5 (May 11, 2010):

  • Project properties dialog – project settings can be modified easily in the new structured dialog.
  • Shift readings time for a loop or entire project – new toolbar icon and context menu item. Reading time can be shifted for a given time interval. Useful if the instrument time is not set properly.
  • Geodetic datum separation – project geodetic datum was separated from the output reference system. At present the software supports WGS-84 and Everest 1830 (1975). Projected system is UTM.
  • Terrain corrections from DTM grid – two methods for regional terrain corrections computations were added, Hammer sheet and Plouff vertical prism method. SRTM-3 arcsec data are used as the DTM grid. Shift between gravity elevation data and DTM grid can be added manualy or computed from the observed data.
  • Report bug or propose enhancement from the application – new Help – Report bug menu item added. The reported problem is sent directly to the issue tracker. In addition, optionaly the software usage data can be sent to the developers. No data from projects are sent out of the box.
  • Exception reporting – in case of occurrence of an unexpected exception report can be sent automatically to the issue tracking system.
  • New Recalculate project toolbar button and menu item were added.
  • Many minor improvements and bug fixes.

Release 0.4 (February 12, 2010):

  • Tidal corrections computation using Tamura 1987 tidal potential development (new option computeTidalCorr in Project properties tab).
  • Optional comparison of computed and instrument-provided tidal corrections in Loop report (new option showTidalDifference).
  • Computation of terrain corrections from DTM (experimental).
  • Saving of projects improved.
  • Fixed problem with local time settings.
  • Many minor bug fixes.