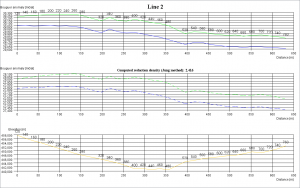
 Starting from Development version 0.7 build 529, Bouguer anomalies and elevations can be plotted over project lines.
Line profile plot can be activated from line edit window.
In addition, reduction density can be assessed based on current reduction density, stations elevations and complete Bouguer anomalies. Jung method, i.e. modified analytic version of the Nettletton method is used for the assessment. Computed reduction density is printed in the plot together with profile plot of Bouguer anomalies computed from the newly assessed reduction density value so as the interpreter can immediately campare influence of the density change.
Context menu is used to toggle density assessment on/off and to save plot as .png picture.
