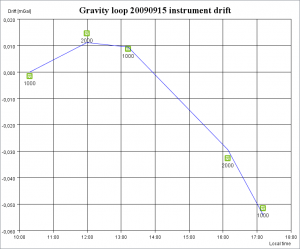
Graphical representation of the instrument drift model together with all repeated readings is available in the Development version of the software.
 Blue line at the plot connects the modelled instrument drift values for each observation time where repeated reading is available. Centers of readings icons – green squares at the presented example – represent observed values of instrument drift. Value of residual, i.e. difference between the model and observed drift, is displayed when mouse pointer is held above a particular reading icon.
Presented example is plot of one of the Tie example loops included with the software distribution.
Plot for each loop is available as a third tab in the Loop editor. Double click the loop icon in the Projects tree and in the Editor window select “View drift plot” button.
You can right-click the plot to save it as a png file. Dimensions of the saved picture are the same as the editor window size. If you want to get a picture suitable for publication, maximaze the window while exporting.
