| 3.4. View and save drift plot | ||
|---|---|---|
| Chapter 3. Processing gravity loops | | |
| 3.4. View and save drift plot | ||
|---|---|---|
| Chapter 3. Processing gravity loops | | |
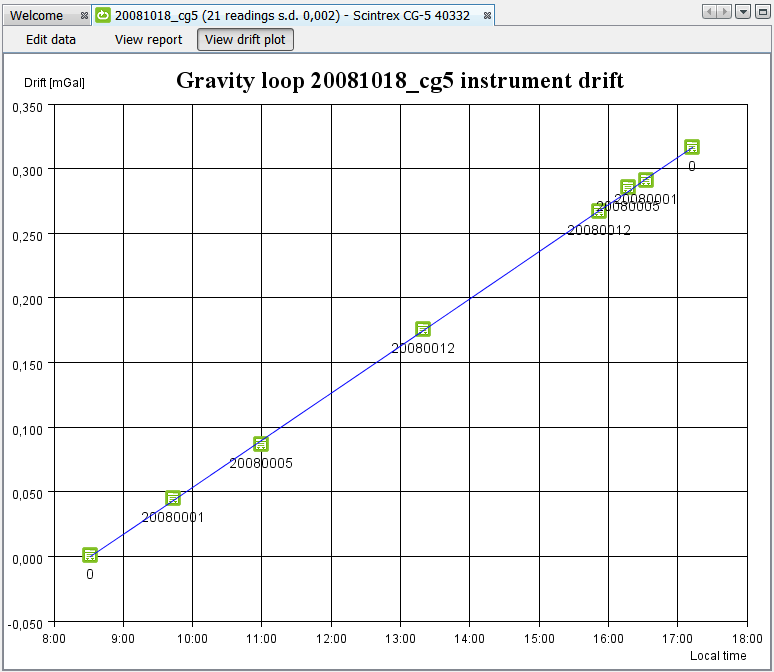
The drift plot provides graphical representation of instrument residual drift determined from repeated occupations at base stations as well as regular stations during the gravity loop.
| Note | |
|---|---|
Computation of the instrument drift can be limited to base stations only. Uncheck the "Use only base readings for drift calculations" checkbox in the Gravity processing Project properties tab to exclude regular stations from drift computation. |
To display drift plot, click the View drift plot button in the loop window.
Computed instrument drift curve is plotted in blue. Centers of stations symbols (squares) represent real values of observed instrument drift. Holding mouse cursor over the station symbol shows residuum, i.e. difference between the drift value of the actual station and the drift value computed from the drift model.
To save drift plot in the PNG format:
Right-click the drift plot.
From the popup menu select the Save plot option.
Select the name for the PNG file or press ENTER to accept default name.
Daily instrument drift value computed from the loop data can be displayed in the title of the drift plot. This value can be used to adjust drift constant of the digital gravimeters.
To compute and present daily instrument drift value:
Right-click the drift plot.
From the context menu select the "Show daily drift value" option.
Select "Hide daily drift value" option to hide the daily drift value.
| Note | |
|---|---|
To correct instrument drift constant of the Scintrex CG-3 or CG-5 digital gravimeters, subtract the presented daily drift value from the actual value of the drift constant. E.g. when the actual drift constant of the CG-5 gravity meter is 0.650 mGal/day and the presented daily residual drift is -0.215 mGal/day, adjusted new value of the instrument drift constant should be 0.865 mGal/day. |
| Caution | |
|---|---|
It is recommended to determine new drift constant from a dedicated long loop, e.g. continuous overnight registration at a single station occupation. Use of short loops or field loops for residual drift determination can lead to unprecise results. |
| | ||
| 3.3. Understanding loop reports | 3.5. Import gravity data from a text dump |