| Chapter 5. Creating maps | ||
|---|---|---|
| | ||
| Chapter 5. Creating maps | ||
|---|---|---|
| | ||
BlueWhaleProcessing software provides functionality for presenting results of processing in the map form. Maps are easily replotted when data were changed and provide flexible way to present intermediate data on the fly at any stage of the project lifecycle.
This chapter describes in detail mapping support features of the software.
| Caution | |
|---|---|
Mapping module is under continuous development. Some of the structures definitions can change in future version which could cause incompatibility of the generated maps with newer versions of the software. At this stage of development, it is not recommended to make production environment criticaly dependent on the new features introduced with the mapping module. |
Each BlueWhaleProcessing project can contain any number of independent maps. A map represents in fact set of parameters constituting the rules how the map presentation has to be created. That means, that the map is independent from the project data and represents a presentation skeleton for the current project snapshot.
When project data are changed, the map is replotted accordingly keeping the same rules for data presentation. Thus, at each moment the map vizualization presents the snapshot of the project data at the given moment.
At present, each map can consist of at most two layers, the compulsory stations layer and the optional grid layer. Stations layer presents stations distribution within the project and grid layer presents selected project data as a coloured contour map layer.
To create a new map:
Right-click the Maps node of the project in Projects window.
Select Add new map item. New map is created under Maps node with default Stations layer.
Double-click the newly created map in the Projects window or select Open from it's context menu. New map opens in the main window.
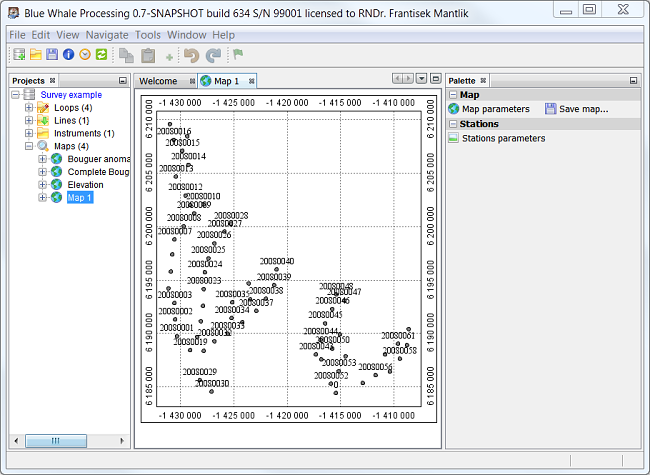
Map plot can be zoomed or panned using the mouse wheel. When Ctrl is pressed together with wheel rotation, map is zoomed/shrinked. When the wheel is pressed down, mouse movement pans the map in the window.
To add a contour layer into the newly created map:
Right-click the map node in the Projects window.
Select Add new map layer and choose desired option from the list.
Available map layers:
Stations elevations map.
Options of gravity processing results plots.
Map of differences between real station elevation and elevation interpolated from the SRTM3 digital terrain model.
This map can be helpful to determine reliability of the digital terrain model data for the area under study.
| | ||
| 4.3. Processing terrain corrections | 5.2. Map Palette tools |