| Chapter 4. Work with lines and stations | ||
|---|---|---|
| | ||
| Chapter 4. Work with lines and stations | ||
|---|---|---|
| | ||
This chapter describes gravity stations database and functions available in the BlueWhaleProcessing software to manipulate stations data.
First section describes in detail parameters saved for each station in the project database. Line editor window is explained in detail.
Next section describes various formats available for import of stations coordinates and detailed description of the import procedure.
Finally, procedures available for processing of terrain corrections are described.
Gravity stations in the BlueWhaleProcessing project are grouped into lines. The software does not have limitations concerning the way how stations are grouped into lines. The only requirement is that line and station names/numbers must be equal to the names contained in the gravimeter dump file for the corresponding gravity reading.
| Note | |
|---|---|
If you want to use the experimental line plot function, organize your stations into lines according to their assignment to individual profiles for the profile plots to be drawn correctly. |
State of each line in the BlueWhaleProcessing project is signalled by the line icon:
 Line is empty.
|
 Some stations of the line are not fully resolved.
|
 All stations of the line are completely resolved.
|
Parameters of all stations of any line can be revised and edited in the Line editing window. To open it, double-click the line in the Projects window or select Open from the line context menu.
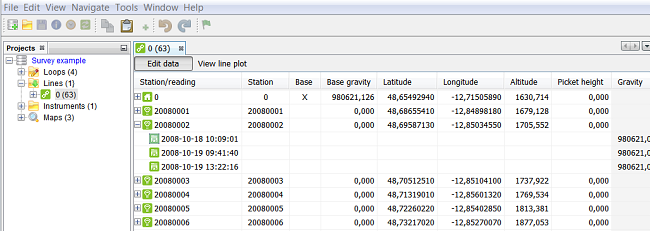
Each line in the line editor represents a gravity station. The station can be expanded by a click to the "+" symbol to display all gravity readings at this station from the whole project.
Clik the cell or press F2 to edit station parameters. Press ENTER when editing is finished. Grayed columns and expanded gravity readings parameters can not be edited.
Description of the Line editor window editable columns:
Station icon can be represented by one of the three possible symbols:
 Regular station
|
 Regular station with terrain correction computed
|
 Base station
|
Icon color represents the processing state of the station:
 Missing station coordinates.
|
 Station horizontal coordinates are defined, altitude is missing.
|
 No gravity readings for the station exist.
|
|
Fully processed station.
|
Station name or number. If you plan to use line plot feature, use numeric station names only sorted along the line, e.g. station position in meters or other convenient unit.
Base station flag. Click the corresponding cell to toggle the flag.
Each gravity loop has to contain at least one base station.
Absolute gravity value of the base station marker. All readings of a loop containing the base station will be tied to this value.
Base gravity value is completely ignored for regular (non-base) stations.
| Caution | |
|---|---|
If a loop contains more than one gravity base, base gravity values for each base have to be consistent (tied together). Othervise loop closure will be wrong. |
Station latitude. Positive value means Northern latitude, negative value represents Southern latitude.
When the "latitude" cell for a station is edited or new value is pasted into, either latitude in degrees or UTM Easting value in meters can be entered. If UTM Easting was entered (value is greater than 90), following conversion procedure takes place when ENTER is pressed:
Old station coordinates are converted to UTM according to datum settings in the Project Properties.
Computed UTM Easting value is replaced with the entered value.
Resulting UTM coordinates are converted back to geographic coordinates and both station latitude and longitude are replaced with new values.
Station longitude. Positive value means Eastern longitude, negative value represents Western longitude.
When the "longitude" cell for a station is edited or new value is pasted into, either longitude in degrees or UTM Northing value in meters can be entered. If UTM Northing was entered (value is greater than 180), following conversion procedure takes place when ENTER is pressed:
Old station coordinates are converted to UTM according to datum settings in the Project Properties.
Computed UTM Northing value is replaced with the entered value.
Resulting UTM coordinates are converted back to geographic coordinates and both station latitude and longitude are replaced with new values.
Elevation of the station gravity marker in meters referenced to the datum defined in Project parameters. Zero value means undefined elevation.
| Note | |
|---|---|
Internally, all elevations are stored referenced to the WGS84 ellipsoid. That means, that if you need to enter zero value (undefined elevation), elevation datum must be set to WGS-84 ellipsoidal first. On the other hand, if your station elevation is zero (referenced to WGS-84 ellipsoid), enter a very small value below survey resolution threshold, e.g. 0.00001 instead to include the station into processing. |
Relative elevation of the geodetic marker above the gravity marker for the station.
Description of the station. Content of the field is printed in reports at the end of the station line.
Description of the non-editable columns:
Absolute gravity for the given gravity reading in mGal.
This field is filled in for the expanded gravity readings of the station only.
Average of absolute gravity values over all gravity readings existing for the given station in the entire project.
Standard deviation computed from repeated readings available for this station. In case of only a single reading existing for the station, zero is presented.
Absolute value of the maximum difference between average gravity and absolute gravity of each reading for this station.
Terrain correction computed for the station.
Depending on the Terranin corrections settings in Project Properties, the value is computed automatically or can be entered manually.
Switch Terrain corrections to None in Project Properties, close and reopen the project in order to reset corrections for all stations to zero (not computed yet).
If Terrain corrections setting is set to Plouff or Hammer and current value of the terrain correction is zero for the station, automatic computation of the terrain correction takes place with next project recalculation.
| Warning | |
|---|---|
The line/profile plot feature is experimental in this version of the BlueWhaleProcessing software. The feature can change in the future versions. It is not recommended to set up production environment criticaly dependent on this feature at this stage of development. |
Line plot can be plotted for lines with all reductions, including terrain corrections, applied.
To open the Line plot window, click the View line plot button in the upper part of the Line Editor Window.
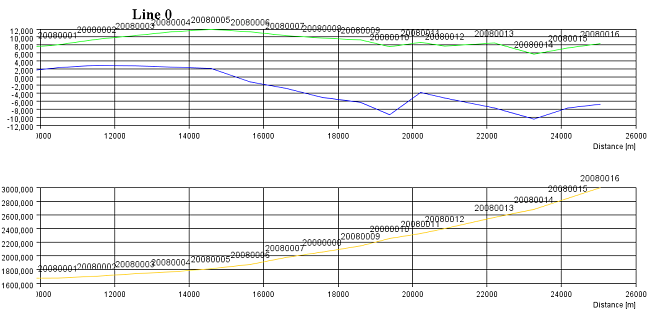
The Line plot consists of two graphs. The upper graph represents Bouguer anomaly plot (blue line) and Complete Bouguer anomaly plot (green line) over the extent of the line. The lower graph plots stations elevations as a brown line.
To save the plot as a .png image, right-click the window and select Save plot. To print the plot, select File - Print from the main menu.
Right-click the plot and select the "Toggle show computed reduction density" to add the third graph into the plot together with reduction density computed with the Jung's method, analytic modification of the Nettletton method [Jung 1953].
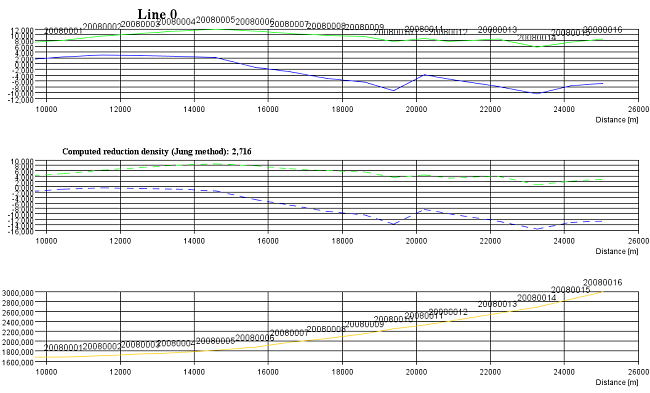
The new graph shows both Bouguer anomaly and complete Bouguer anomaly plots computed with the use of the computed new reduction density. Dashed lines are used for both curves.
Right-click the plot and select the "Toggle show computed reduction density" again to hide the additional plot.
| | ||
| 3.6. Batch data updates | 4.2. Import stations coordinates |